Example - Block periodization
This notebook shows features of streprogen, the Python strength program generator.
Contributions to the code are welcome. :)
[1]:
!pip install streprogen matplotlib --quiet
Imports
[2]:
from streprogen import (Program,
                        reps_to_intensity,
                        progression_diffeq,
                        progression_sawtooth,
                        progression_sinusoidal)
import matplotlib.pyplot as plt
import functools
[3]:
duration = 12
Set up periodization of intensity and repetitions
You can periodize intensity and repetitions by using progression_sawtooth or progression_sinusoidal or creating custom functions.
Below I show how to create custom functions.
[4]:
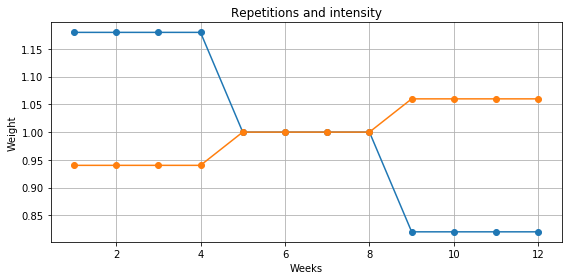
def rep_scaler_func(week:int):
    """Custom factors that are multiplied with the `reps_per_exercise`."""
    index = week - 1
    factors = [1.18] * 4 + [1.0] * 4 + [0.82] * 4
    return factors[index % len(factors)]

def intensity_scaler_func(week:int):
    """Custom factors that are multiplied with the `intensity`."""
    index = week - 1
    factors = [0.94] * 4 + [1.0] * 4 + [1.06] * 4
    return factors[index % len(factors)]
[5]:
plt.figure(figsize=(8, 4))
plt.title("Repetitions and intensity")

weeks = list(range(1, duration + 1))

y = [rep_scaler_func(w) for w in weeks]
plt.plot(weeks, y, '-o', label="Rep scalers (factors)")

y = [intensity_scaler_func(w) for w in weeks]
plt.plot(weeks, y, '-o', label="Intensity scalers (factors)")

plt.xlabel("Weeks"); plt.ylabel("Weight"); plt.grid(); plt.tight_layout()
Optional: Set up periodization of strength progression (weight lifted)
You can periodize progression by using progression_sawtooth or progression_sinusoidal or creating your own custom function. Below I show how to create a custom function.
[6]:
def progression_func(week, *args, **kwargs):
    weight = progression_diffeq(week, *args, **kwargs, k=1)
    # Multiply every 4th week by 0.95 for a deload week
    if (week - 1) % 4 == 0:
        return weight * 0.95
    else:
        return weight
[7]:
plt.figure(figsize=(8, 4))
plt.title("Relationship between weeks and general strength progression")

weeks = list(range(1, duration + 1))

y = [progression_func(w, start_weight=100, final_weight=120, start_week=1, final_week=12) for w in weeks]
plt.plot(weeks, y, '-o')

# Set up the plot and show it
plt.xlabel("Weeks"); plt.ylabel("Weight (relative)")
plt.grid(); plt.tight_layout()
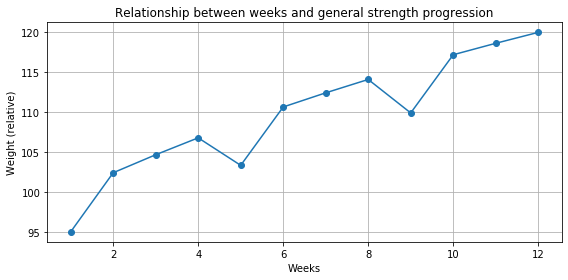
While it’s possible to create any progression function, using tweaking defaults is often wise, e.g.,:
[8]:
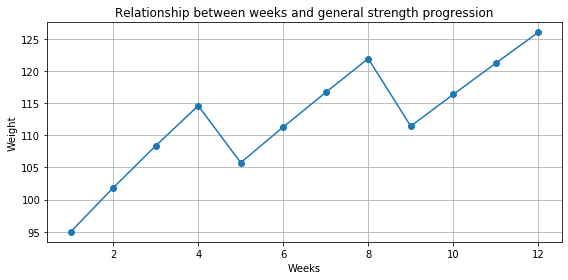
plt.figure(figsize=(8, 4))
plt.title("Relationship between weeks and general strength progression")

weeks = list(range(1, duration + 1))

# Using the `progression_sawtooth` function, we can create out own progression
# function by specifying:
# - k: the non-linearity
# - period: the length of the period (in weeks)
# - scale: the amplitude of the sawtooth
progression_func = functools.partial(progression_sawtooth, k=2.0, period=4, scale=0.05)

y = [progression_func(w, start_weight=100, final_weight=120, start_week=1, final_week=12) for w in weeks]
plt.plot(weeks, y, '-o')

# Set up the plot and show it
plt.xlabel("Weeks"); plt.ylabel("Weight")
plt.grid(); plt.tight_layout()
Program setup
Below is the code creating the program.
The functions rep_scaler_func, intensity_scaler_func and progression_func are created in the code above.
[9]:
program = Program(
    name='BlockPeriodization',
    duration=duration,
    reps_per_exercise=20, # Baseline reps per exercise, multiplied by `rep_scaler_func(week)`
    min_reps=1,
    max_reps=8,
    percent_inc_per_week=1,
    intensity=84, # Baseline intensity, multiplied by `intensity_scaler_func(week)`
    rep_scaler_func=rep_scaler_func,
    intensity_scaler_func=intensity_scaler_func,
    units='',
    # Comment out the line below to use the default progression
    progression_func=progression_func,
    round_to=2.5,
)


# Here we only use a single day and exercise to show the periodization
# A realistic program would of course include more exercises :)
with program.Day("A"):
    program.DynamicExercise(name="Squat", start_weight=100)
Render the program
[10]:
# Do the computations and render a program. Might take a few seconds.
program.render()
Print and save the program
[11]:
print(program)
----------------------------------------------------------------
Program: BlockPeriodization

Program parameters
  duration: 12
  reps_per_exercise: 20
  intensity: 84
  units:
----------------------------------------------------------------
Exercise information
  A
   Squat   100 -> 112
    reps: [1, 8]   weekly inc.: 1.0%
----------------------------------------------------------------
Program
 Week 1
  A
   Squat   7 x 75     7 x 75     6 x 77.5   5 x 80

 Week 2
  A
   Squat   7 x 77.5   7 x 77.5   6 x 82.5   5 x 85

 Week 3
  A
   Squat   7 x 82.5   7 x 82.5   6 x 85     5 x 90

 Week 4
  A
   Squat   7 x 87.5   7 x 87.5   6 x 90     5 x 92.5

 Week 5
  A
   Squat   6 x 82.5   5 x 85     5 x 85     4 x 87.5

 Week 6
  A
   Squat   6 x 85     5 x 90     5 x 90     4 x 92.5

 Week 7
  A
   Squat   6 x 90     5 x 92.5   5 x 92.5   4 x 97.5

 Week 8
  A
   Squat   6 x 92.5   5 x 97.5   5 x 97.5   4 x 100

 Week 9
  A
   Squat   4 x 92.5   4 x 92.5   3 x 95     3 x 95     2 x 97.5

 Week 10
  A
   Squat   4 x 95     4 x 95     3 x 100    3 x 100    2 x 102.5

 Week 11
  A
   Squat   4 x 100    4 x 100    3 x 102.5  3 x 102.5  2 x 107.5

 Week 12
  A
   Squat   4 x 102.5  4 x 102.5  3 x 107.5  3 x 107.5  2 x 110

----------------------------------------------------------------
Export the program as .html or .tex, then to .pdf
A .html file can be printed directly from your browser, or printed to a .pdf from your browser.
[12]:
# Save the program as a HTML file
with open(f'{program.name}.html', 'w', encoding='utf-8') as file:
    # Control table width (number of sets) by passing the 'table_width' argument
    file.write(program.to_html(table_width=8))
[13]:
# Save the program as a TEX file
with open(f'{program.name}.tex', 'w', encoding='utf-8') as file:
    file.write(program.to_tex(table_width=8))
Use a .tex to generate .pdf if you have LaTeX installed, or use:
- latexbase.com from your browser.
[14]:
# If you have LaTeX installed on your system, you can render a program to .tex
# Alternatively, you can paste the LaTeX into: https://latexbase.com/

# Remove the comment below to print the .tex file
# print(program.to_tex(table_width=8))